How to Add Visual Cues to Microsoft Dynamics 365 Business Central
- William Schroeder
- May 10, 2024
- 3 min read
Updated: Aug 23, 2024
Introduction
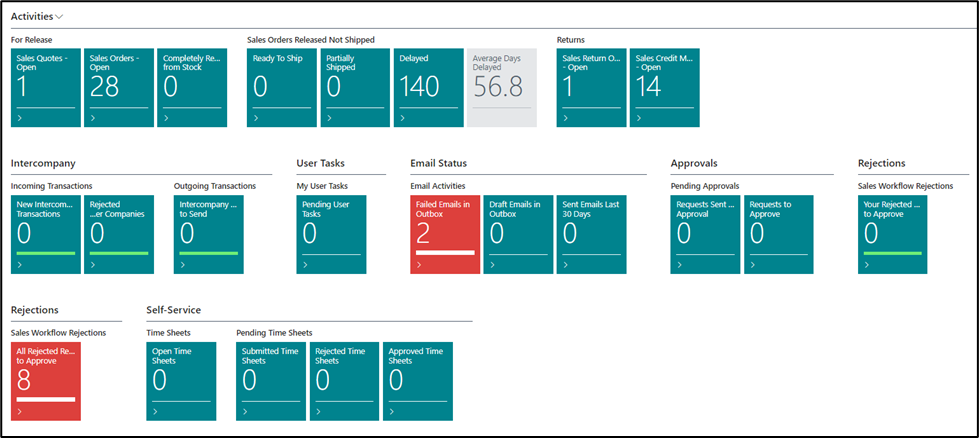
Microsoft Dynamics 365 Business Central provides a comprehensive view of data on its main Role Center landing page. This personalized and user-configured dashboard offers a 360-degree perspective on critical business information. One of the key features that enhance this experience is the use of visual "cues" or tiles, as shown below.
For the most part, these tiles are standard as part of a stock Business Central deployment, and individual cues can be shown/hidden and moved according to user profiles. New cues can even be added via the Cue Setup page, which allows low/high metrics to be defined on existing cue tables, which are tables already defined to store aggregated and/or calculated data for particular data elements, such as bank deposits, invoices, returns, et cetera. The page ID is 9701 and can be accessed by any user with the appropriate security rights. An example is below.
Adding tiles is easy for defined cue tables, but what if you wanted to add a cue for data that are not already contained in flow fields or in aggregated tables? In the first screen capture, the two example tiles under the Rejections heading are custom cue tables that display rejected sales orders pending approval for the current user (still tracking as green, defined as zero rejected sales orders) as well as all rejected sales orders still pending approval for all users (tracked as red, defined as more than zero). Obviously, the “all users” rejection tile will be displayed for users in a “sales management” or equivalent role, while the other “per user” tile is only applicable to current Business Central session user.
All rejected sales orders pending approval for the current user
All rejected sales orders pending approval across all users
How is this accomplished? First, it is important to note that this can only be accomplished as AL code within the Visual Studio Code environment, and the first step is to create one construct for each tile. This means new custom tables or table extensions need to be coded since the tile construction is dependent upon calculated fields. Once the data storage is defined, one CardPart page must be defined for each tile, and these pages contain the actual logic used to display the totals as well as the metrics used to determine “favorable” or “unfavorable” numbers. In our example, we extended the Sales Header table per below.
Next, we defined one page for the Per-User Rejection Cue and another for the All Users Rejection Cue, with each page essentially calculating the number of sales orders that have been rejected and are still in an Open status. The below code snippet provides a conceptual overview of how that was accomplished.


Finally, the “green” and “red” status of each tile is accomplished by defining the color style of the cues such that green means that no rejected sales orders are still in an open state, while red denotes that one or more rejected sales orders are still open, for the current user or for all users.
Conclusion
Once the extension is packaged and deployed, all that remains is to define the location and visibility of the cues per user profile, which is standard Business Central functionality. Remember that cues enhance user productivity by providing quick insights into critical metrics. Whether it’s monitoring sales, inventory levels, or customer engagement, well-designed cues contribute to an efficient and informed user experience. We hope you find this tutorial useful on how to add visual cues in Business Central.


Commentaires